8 min read
For 300 devices, the estate determines Zabbix or Prometheus
A practical Zabbix or Prometheus comparison for 300 devices, covering SNMP and servers, setup effort, alerting flexibility, and administrator skills.
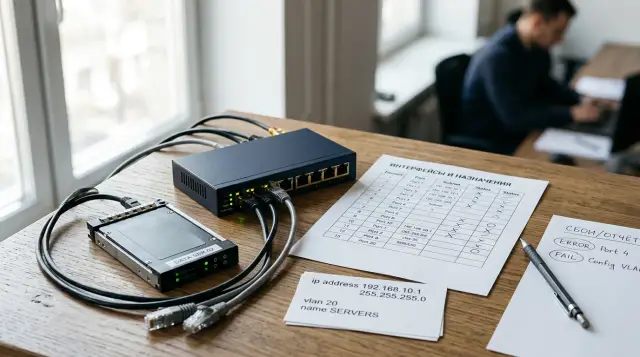
The choice is determined not by the number 300, but by what those 300 devices are and how the team works. If the estate contains many switches, routers, UPS units, printers, and conventional servers, Zabbix will almost always go live faster and require less manual assembly. If most of the workload runs in services, containers, and applications that already expose metrics, Prometheus offers a stronger query language and fits more naturally into a Git based workflow.
I would not make the decision after looking at an attractive demo screen. Both products can easily show CPU utilization and node availability. The difference appears later, when you need to add an unfamiliar switch model, stop a flood of messages after a core network failure, understand storage growth, and hand an on-call shift to an administrator who does not write PromQL.
Three hundred devices do not define the load
The device count alone says almost nothing about the size of a monitoring system. One server with an agent may provide a hundred useful metrics, while a switch with hundreds of ports will create far more items or time series after interface discovery. The relevant variables are the number of collected metrics, polling interval, number of labels, retention period, and the share of unreachable targets that keep a poll waiting for a timeout.
Before choosing, divide the estate into at least four groups: network equipment monitored over SNMP, server operating systems, infrastructure services such as databases and hypervisors, and applications with their own metrics. Then record the access method and owner for each group. This table is more useful than the requirement "support 300 devices" because it immediately exposes the amount of custom work.
For SNMP, count discovered entities as well as chassis: physical ports, VLANs, power supplies, sensors, and access points. Do not enable every MIB table just because it is available. Polling administratively disabled ports and temporary interfaces increases storage use and creates events that nobody investigates. The Zabbix template guidelines explicitly recommend low level discovery and filtering unnecessary entities. The snmp_exporter generator also supports static and dynamic index filters. In both systems, savings start with the data model, not with adding a CPU to the monitoring server.
For servers, decide whether you need only basic CPU, memory, disk, and availability metrics or also services, logs, hardware sensors, RAID status, and application checks. Prometheus treats every unique label set as a separate time series. An unbounded label containing a request or user ID can create more load than the rest of the estate. A similar mistake in Zabbix occurs when low level discovery creates thousands of items and triggers from a volatile list.
Start a practical estimate with the flow of new values. Multiply active items or series by collection frequency, then test retention and disk headroom in the pilot. A theoretical estimate is useful for the initial virtual machine size, but templates, labels, and data churn determine actual consumption. Comparing the products on empty installations tells you nothing.
A mixed estate goes live faster in Zabbix
Zabbix is easier when one administrator needs to see network equipment and servers in a shared host model. SNMP, ICMP, agent checks, IPMI, web checks, and many ready-made templates sit inside one product. A host receives an interface, an administrator links a template to it, and low level discovery creates items, triggers, and graphs for discovered ports or file systems.
The official Zabbix SNMP documentation suggests using ready-made templates and warns administrators to check compatibility with the specific device. That warning matters. A vendor name on a template does not guarantee identical OIDs, indexes, and states across product lines and firmware versions. I always test one unit of a model with snmpwalk, inspect the actual responses, and only then link the template at scale.
snmpwalk -v3 -l authPriv -u monitor -a SHA256 -A 'AUTH_PASS' \
  -x AES -X 'PRIV_PASS' 192.0.2.15 1.3.6.1.2.1.2.2.1.8

IF-MIB::ifOperStatus.1 = INTEGER: up(1)
IF-MIB::ifOperStatus.2 = INTEGER: down(2)
The output shape answers two questions at once: whether the required OID is available and which indexes the device actually returns. Do not put the example secrets in shell history; use a protected method to pass credentials in a working environment. An SNMPv1 or v2c community string travels without encryption, so SNMPv3 with authentication and privacy is the sensible choice on a managed network.
With Prometheus, network polling is usually built around a separate snmp_exporter. Prometheus calls its HTTP endpoint, the exporter polls the target over SNMP, and it converts indexes into labels. The standard if_mib module quickly supplies interface statistics, but vendor-specific sensors and tables require you to collect the MIBs, define generator.yml, generate snmp.yml, select a module, and verify metric names. The project README explicitly says that the resulting snmp.yml should not be edited by hand. Changes belong in the generator configuration.
Prometheus also needs node_exporter on Linux servers, while Windows typically uses a separate exporter. This is a sound architecture, but the components must be installed, upgraded, secured, and inventoried. Zabbix also requires agent deployment, but its server, templates, events, and notification delivery form one administrative environment. That cohesion reduces initial work in a mixed estate.
Prometheus is stronger beside applications
Prometheus wins when applications and platforms already publish metrics in its format. It retrieves values over HTTP, adds target labels, and lets operators connect metrics with PromQL queries. For a team that manages Kubernetes, services, and configuration through Git, this approach is easier to extend and test alongside code.
PromQL shows its strength not on a CPU graph, but in questions that span objects. An operator can calculate an error ratio by service, exclude the test environment, compare request rate with available instances, and aggregate the result by team or region. Calculated items and trigger expressions in Zabbix solve many operational tasks, but Prometheus handles ad hoc analysis of multidimensional metrics more naturally.
Target discovery also reflects where the product came from. Prometheus can obtain targets from Kubernetes, Consul, and other supported mechanisms, while file and HTTP discovery cover an in-house inventory system. The official file-based service discovery guide shows a JSON list of targets and labels. Prometheus watches the file and accepts changes without a restart. This may feel like unnecessary work for a static server list, but a dynamic platform quickly repays the effort.
The advantage disappears when a team uses Prometheus as a replacement for a ready-made switch monitoring system. It then has to assemble the exporter, SNMP modules, recording rules, alert rules, Alertmanager, receivers, and a visualization interface. Each component is good at its job, but the number of joints remains a fact. Three hundred targets that are mostly network devices and conventional servers rarely justify this assembly without another reason.
Do not choose Prometheus merely because its configuration lives in YAML. A file in Git does not become good automatically. You need review, syntax validation, rule tests, and a clear release process. Prometheus includes promtool test rules for unit testing alert rules. A team that uses it gains reproducibility. If people edit files directly on the server, most of the advantage over Zabbix forms disappears.
Initial setup depends on custom targets
The rollout time is determined not by installing the monitoring server, but by the number of target types that lack a suitable template or exporter. A clean installation of either product takes only a small part of the project. Most effort goes into access, an ownership map, interface exclusions, thresholds, notification routes, and checking that the data really means what its name claims.
The pilot must include awkward devices, not only a new server and a popular switch. Take an old model with strange SNMP behavior, a node across a slow link, a server with several disk groups, one important database, and an application with its own metrics. If a solution handles these, connecting repeated models at scale will be predictable.
For a fair comparison, run the same sequence:
- Connect one example of each class and record every manual change.
- Configure identical intervals, retention periods, and a minimally useful metric set.
- Simulate a lost node, a full disk, an uplink failure, and a target that stops sending data.
- Give another administrator only your instructions and ask them to add the second target.
- Update a template or rule and verify that the change can be rolled back safely.
In Zabbix, export modified templates and store them with documentation for local macros. Otherwise, important decisions remain only in the database and the author's memory. In Prometheus, keep the scrape configuration, rules, Alertmanager configuration, SNMP generator, and tests together. One repository does not mean one process: these files have different validation and reload methods.
Do not compare effort by counting clicks or lines of YAML. Record how many different artifacts an administrator changes when adding a new device type, where an error is checked, and what rollback looks like. Zabbix complexity often hides in template inheritance, macros, and prototypes. Prometheus complexity is visible in relabeling, labels, exporters, and routes. Visible complexity is usually safer than hidden complexity when the team knows how to operate it.
Alerts are easier in Zabbix and more flexible in Alertmanager
Zabbix provides a complete path from a received value to a message for the on-call person more quickly. An item stores a metric, a trigger calculates state, an action selects the recipient and channel, and escalation steps repeat the message or pass it to another group. Delivery methods include email, SMS, scripts, and webhooks. Operators configure and inspect all of this in one interface.
Prometheus splits that flexibility between alert rules and Alertmanager. Prometheus evaluates an expression, holds state with for when required, and sends an event to Alertmanager. Alertmanager groups and deduplicates events, applies inhibition, chooses a routing-tree branch, and selects a receiver. Labels such as team, service, site, and severity become a contract between collection, rules, and delivery.
On paper, an Alertmanager routing tree is cleaner than many separate actions. In practice, it demands naming discipline for labels. If one rule sets site=almaty, another uses location=almaty, and the route expects region, notifications go to the root receiver. Syntax validation passes, but the organizational error remains. Test sample events for every routing branch, not just PromQL.
A typical network failure exposes the difference particularly well. The core switch disappears, followed by dozens of servers, access points, and UPS units. Without dependencies, Zabbix creates separate problems for every target. You must define trigger dependencies, service relationships, or correlation in advance so the on-call person sees the cause. In Prometheus, every target gets up=0; Alertmanager then groups messages by site and can inhibit child alerts while a network-node alert is active. The inhibition works only when the source rule and child events carry matching labels.
The official Alertmanager documentation explains group_wait separately: a short wait sends the first message sooner, but the group may be incomplete and an inhibiting alert may not arrive in time. A long wait gives correlation time to work, but delays the signal. This parameter should not be copied from somebody else's example. A link loss and a filling disk tolerate different delays.
If one system administrator configures notifications through an interface, Zabbix is easier to maintain. If application teams own rules, review them, and use a shared label taxonomy, Alertmanager is more flexible. Neither product repairs bad thresholds on its own. An alert should require action, have an owner, and explain what to check. Other signals belong on a dashboard.
Administrator skills change the total cost
Zabbix lowers the entry barrier but does not remove the need for engineering knowledge. An administrator must understand Linux, networking, SNMP, the database, polling queues, caches, server processes, and template inheritance. The graphical interface helps locate an object and see an error, but a complex template with dependent items and JavaScript preprocessing still demands careful debugging.
Prometheus requires Linux, HTTP, the time-series model, PromQL, YAML, service discovery, relabeling, and exporter operations. Reliable notifications also add Alertmanager, message templates, and inhibition rules. If data goes to remote storage, the team gains another environment with its own capacity and failures. This set suits an SRE or platform team, but it overloads a generalist administrator who also manages networks, accounts, and backups.
The difference is obvious during an on-call handover. In Zabbix, a new employee can move from the host to its latest value, trigger, and action through the interface. In Prometheus, that person must trace a target through service discovery, an exporter, labels, a rule query, and the routing tree. This path can be documented well, but someone has to write the documentation. The note "everything is in Git" does not explain why relabeling removes a label or which generator created an SNMP module.
Assess dependence on one specialist. Ask a second administrator, without hints, to add a device model, change a threshold for only one site, schedule maintenance, and explain a missing notification. If the task stops at an obscure command or screen, you have found an operational risk. The product choice matters less than fixing the instructions and access rights.
Upgrades also differ in character. With Zabbix, the server, interface, database schema, proxies, and agents must be upgraded coherently according to the compatibility matrix. In a Prometheus stack, separate binaries can be upgraded independently, but configuration compatibility and integration behavior must be checked for each component. A monolith has fewer moving parts, while a component set narrows the scope of one upgrade. Neither provides simplicity for free.
For an organization without a dedicated monitoring team, I treat maintenance as the main criterion. The system must survive its author's vacation, a contractor change, and a replacement equipment model. If the current team reads PromQL fluently and already maintains exporters, Prometheus does not add an unfamiliar skill. If those skills are absent, training becomes part of the cost even when the software license is free.
Storage must be sized by data, not by brand
Both systems can fit on one appropriately sized server with a disciplined metric set for 300 devices, but nobody can name the right size without a pilot. Zabbix writes history and trends to a relational database, and performance depends on new values per second, data types, housekeeping, table partitioning, and cache settings. Prometheus stores time series in its local TSDB, where volume depends on series count, interval, label churn, and retention.
The official Prometheus documentation warns that local storage is limited by the scalability and durability of one node. This does not mean that 300 targets immediately require a distributed system. First configure time or size retention, monitor Prometheus itself, and back up the configuration. Consider remote write and compatible external storage for long history, shared storage across instances, or special availability requirements, but remember that it adds operational work.
The Zabbix database often becomes the first problem when a team enables heavy templates and keeps detailed history for too long. Trends store aggregates for numeric data and make long periods cheaper to view, but they cannot replace raw values for every investigation. Set history periods by data class: a port state and interface utilization may need different depth.
Measure growth in the pilot. After discovery stabilizes, record the data size at the same time for several days, note the active item or series count, and investigate sharp jumps. In Prometheus, a query against internal TSDB metrics shows the number of series and sample ingestion rate. In Zabbix, internal items and the queue show whether pollers and handlers keep up. One overall CPU percentage explains none of this.
Do not use high availability as an excuse for premature complexity. First define acceptable history loss and time without alerts. A configuration backup does not preserve metrics, and a database replica does not test webhook delivery. A monitoring system needs a separate failure test: stop the primary process, confirm the switchover, and verify that the on-call person receives one clear message rather than two copies from both nodes.
Network placement matters more than the interface
A Zabbix proxy provides a clear way to collect data at a remote site and forward it to the central server. The proxy polls local targets, buffers values during a link outage, and reduces the number of permitted flows between segments. For branches and isolated zones, this often matters more than dashboard convenience.
Prometheus is usually placed near targets or allowed to poll HTTP endpoints across zone boundaries. You can run snmp_exporter on several central machines, and its documentation explicitly describes the component as a kind of proxy for SNMP. Ordinary exporters expose HTTP, however, so you must plan listening addresses, firewalls, TLS, and authentication. Do not expose operational endpoints to a user network by default.
SNMP needs its own threat model. Versions v1 and v2c do not encrypt the community string, while v3 supports authentication and privacy. Create a read-only account, restrict source addresses on the equipment, and keep secrets out of public configuration. The snmp_exporter documentation allows the username, password, and privacy password to come from environment variables when the expansion flag is enabled. This is better than plain text in a repository, but the secret still has to reach the process safely.
Agent access also involves more than an open port. Decide who initiates the connection, how each side is authenticated, which commands are allowed, and what happens if the monitoring server is compromised. A central system can see almost the whole estate and stores credentials, so its administrative interface, backups, and logs require tighter access than an ordinary dashboard.
Draw the flows before installation: server or proxy to SNMP, Prometheus to exporter, agent to server, and the monitoring system to email or a webhook. Record ports, direction, encryption, the rule owner, and behavior when the WAN goes down. This drawing often eliminates one option before the pilot. If policy forbids central HTTP polling of branches, collection must move closer to targets regardless of team preference.
A hybrid is justified only by separate data owners
Using Zabbix and Prometheus together makes sense when they solve different tasks and each has an owner. Zabbix can watch the network, hardware, branch availability, and conventional servers. Prometheus can collect application and container-platform metrics owned by developers or SREs.
A bad hybrid collects the same CPU, memory, and availability data in both systems "just in case." It doubles agents, rules, dashboards, and notifications, and conflicting data starts an argument over the authoritative source. Divide responsibility in writing: which product creates a node alert, where long history lives, and who owns label or template quality.
Integration should not turn one system into an indiscriminate transport for the other. Zabbix can ingest Prometheus data and parse it into dependent items, while Prometheus can receive metrics from suitable exporters, but transferring every metric erases the advantages of the original model. Pass only signals that need a shared on-call route or a shared service view.
A hybrid needs two backup, upgrade, and alert-testing routines. This is a strong argument against it when the organization has one administrator. When separate teams manage the network and platform with different change cycles, separate tools can reduce conflicts. The boundary should follow human responsibility, not technology fashion.
For a conventional 300-device estate, Zabbix has the edge
For an estate of network equipment and servers managed by a small infrastructure team, I would choose Zabbix. It covers SNMP, agent data, discovery, triggers, and message delivery faster without assembling several services. I would choose Prometheus when the proportions are reversed: little conventional SNMP, many applications and containers, existing exporters, a Git process, and staff who write PromQL confidently.
The decision logic is simple:
- For many switches, UPS units, and varied servers, choose Zabbix: a shared host model, built-in SNMP, and templates reduce assembly work.
- If application metrics and dynamic targets dominate, choose Prometheus: labels, PromQL, and service discovery fit the job.
- If an administrator manages alerts through an interface, Zabbix keeps triggers, actions, channels, and escalations in one place.
- If teams own and review the rules, Prometheus lets them validate rules and routes as configuration.
- For branches that operate without a WAN for long periods, a Zabbix proxy provides standard local collection and buffering.
License cost does not settle the question because either option can start without paying for the software code itself. Count the time needed for a new device type, an investigation into missing data, component upgrades, and training a second administrator. Those operations determine cost after a year.
If the organization is also renewing its server infrastructure, GSE.kz can design and integrate suitable server and data-center infrastructure without tying the monitoring choice to one vendor. The decision should still come from your own pilot because the switch model, segmentation policy, and shift skills are more precise than any general comparison.
Finish the pilot with an intentional uplink failure and a handover to another administrator. Choose the system in which that person finds the cause, receives one useful notification, and can explain the configuration without the author nearby. For a mixed estate this will more often be Zabbix; for a platform with ready metrics and a mature SRE practice, the result may honestly be different.
Frequently asked questions
Is Zabbix suitable for 300 devices?
Yes, if you limit the metric set, configure intervals, and test the database against the actual flow of values. For an estate this size, item count and discovered interfaces matter more than host count.
Is Prometheus suitable for monitoring network equipment?
Yes, usually through snmp_exporter and the if_mib module. Vendor-specific OIDs require work with MIBs, the configuration generator, labels, and your own alert rules.
Which is easier to configure from scratch, Zabbix or Prometheus?
Zabbix is usually easier for a mixed estate of servers and network devices because collection, templates, events, and notifications live in one product. Prometheus is easier where exporters and a configuration release process already exist.
Can we operate without a dedicated monitoring administrator?
Yes, if you select a small set of useful checks and document target onboarding, upgrades, and alert investigation. A stack of several components without an owner quickly becomes unreliable.
Which product handles SNMP better?
Zabbix provides a shorter path through its built-in item type, templates, and low level discovery. Prometheus offers a good label model through snmp_exporter but needs more preparation for nonstandard MIBs.
Where can notifications be configured more flexibly?
Alertmanager is more flexible for label-based routing, grouping, and inhibition in an environment with disciplined configuration. Zabbix is easier when one administrator manages triggers, actions, channels, and escalations through a shared interface.
Must Zabbix agent be installed on every server?
No, Zabbix supports several collection methods, but its agent usually provides detailed and manageable operating-system metrics. The decision depends on security policy and the data you need.
Does Prometheus need an exporter for every device?
Not necessarily a separate process for every target. node_exporter usually runs on a server, while one snmp_exporter instance can poll many network devices.
Should we run Zabbix and Prometheus together?
Yes, when the network and application platform have different owners and clearly separated signals. Do not duplicate the same checks and notifications in both systems.
How do we run a fair pilot before choosing?
Use awkward device models, identical intervals, and one set of failures, including a core uplink loss. Then ask a second administrator to add a target and explain the notification route without help from the configuration author.